
This report analyzes the latest trends in Wallet Drainer phishing attacks across the EVM ecosystem, providing insights for industry practitioners and users to better protect their assets.
TL;DR
- Total losses: $83.85M across 106,106 victims — down 83% and 68% respectively from 2024
- Largest single theft: $6.5M via Permit signature (September)
- Dominant signature type: Permit remained primary; EIP-7702 malicious signatures emerged after the Pectra upgrade, with 2 large cases in August
Big Picture
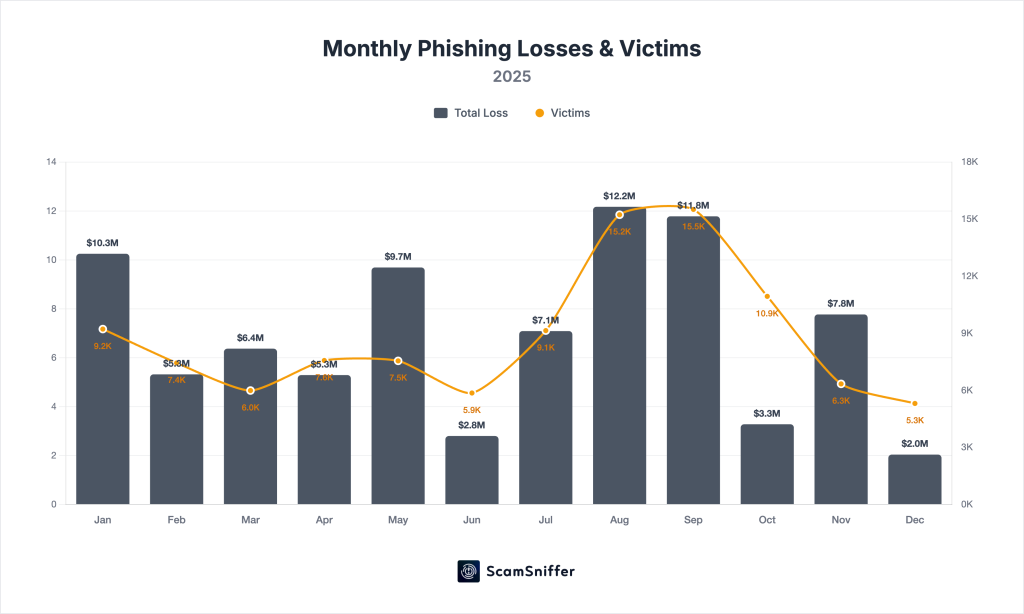
2025 saw signature phishing losses plunge from $494M to $83.85M — but the threat didn’t disappear. Losses fluctuated with market cycles.
Market correlation: Phishing losses tracked closely with market activity. Q3 saw both the strongest ETH rally and the highest phishing losses ($31M). When markets are active, overall user activity increases, and a percentage fall victim — phishing operates as a probability function of user activity.
- Observed: Monthly losses ranged from $2.04M (December) to $12.17M (August), correlating with market cycles.
- Q3 peak: August-September accounted for 29% of yearly losses during the market’s most active period.
- Q4 decline: As markets cooled, losses fell to $13M — the quietest quarter.
Overview
Definitions
- Wallet Drainer: Phishing infrastructure deployed on malicious websites that induces users to sign harmful transactions, enabling rapid asset extraction.
- Signature Phishing: Attacks that trick victims into signing malicious transactions (approve, permit, setApprovalForAll, etc.) through phishing websites.
Methodology
- Scope: EVM-compatible chains
- Coverage: Wallet drainer attacks via phishing websites only; excludes direct hacks, exchange compromises, smart contract exploits, and other theft vectors
- Valuation: USD value at time of theft
- Limitations: Lower bound estimate; based on trackable drainer activity only; unreported incidents not captured
Key Data Comparison
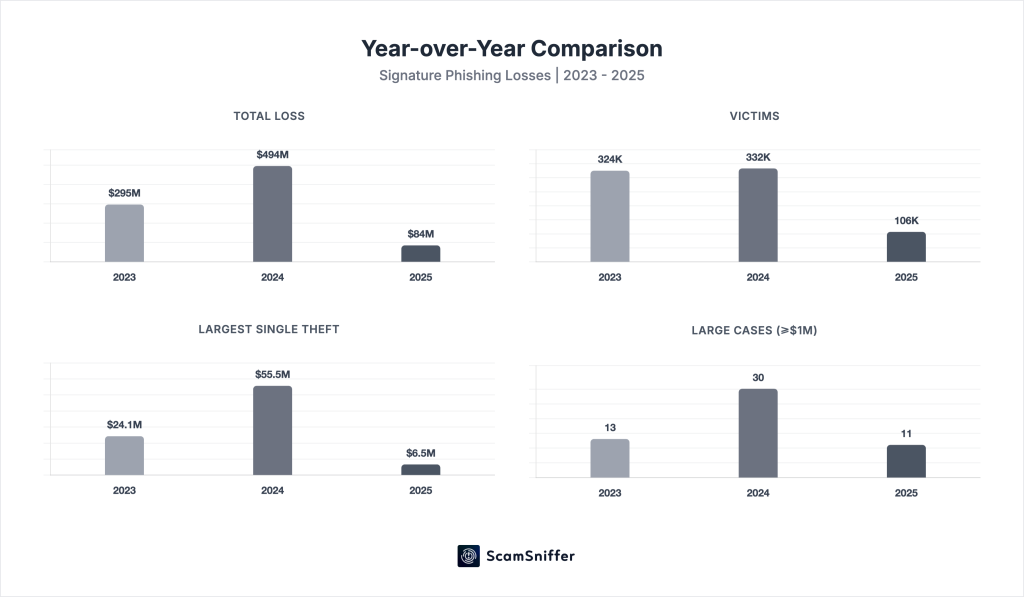
| Indicator | 2025 | 2024 | 2023 | YoY Change |
|---|---|---|---|---|
| Total Loss | $83.85M | $494M | $295M | -83.0% |
| Victims | 106,106 | 332,000 | 324,000 | -68.0% |
| Largest Single Theft | $6.5M | $55.48M | $24.05M | -88.3% |
| Large Cases (≥$1M) | 11 | 30 | 13 | -63.3% |
Loss Analysis
Monthly Breakdown
| Month | Losses | Victims | MoM Change |
|---|---|---|---|
| Jan | $10.25M | 9,220 | -56% |
| Feb | $5.32M | 7,442 | -48% |
| Mar | $6.37M | 5,992 | +20% |
| Apr | $5.29M | 7,565 | -17% |
| May | $9.69M | 7,547 | +83% |
| Jun | $2.80M | 5,862 | -71% |
| Jul | $7.09M | 9,143 | +153% |
| Aug | $12.17M | 15,230 | +72% |
| Sep | $11.78M | 15,513 | -3% |
| Oct | $3.28M | 10,935 | -72% |
| Nov | $7.77M | 6,344 | +137% |
| Dec | $2.04M | 5,313 | -74% |
Quarterly Summary

| Quarter | Losses | Victims | Avg Loss/Victim | Market |
|---|---|---|---|---|
| Q1 | $21.94M | 22,654 | $969 | Declining |
| Q2 | $17.78M | 20,974 | $848 | Recovering |
| Q3 | $31.04M | 39,886 | $778 | Strong rally |
| Q4 | $13.09M | 22,592 | $580 | Cooling off |
Key Observations
- Market-Loss Correlation: Q3’s highest losses ($31M) coincided with ETH’s strongest rally. More market activity = more potential victims.
- November Anomaly: Losses surged 137% while victims dropped 42%, with average loss per victim rising to $1,225 — a monthly fluctuation rather than a confirmed trend.
- December Cool-off: Lowest month ($2.04M) as market activity declined year-end.
Major Theft Analysis
Cases Exceeding $1M
| Amount | Asset | Date | Signature Type |
|---|---|---|---|
| $6.50M | stETH, aEthWBTC | Sep | Permit |
| $3.13M | WBTC | May | increaseApproval |
| $3.05M | aEthUSDT | Aug | Transfer |
| $1.82M | cUSDCv3 | Mar | Transfer |
| $1.54M | Multiple | Aug | EIP-7702 batch |
| $1.43M | Multiple | Apr | Approve |
| $1.23M | Uniswap V3 NFTs | Jul | setApprovalForAll |
| $1.22M | aPlaUSDT0 | Nov | Permit |
| $1.06M | sUSDf, USDe | Jul | Approve |
| $1.00M | Multiple | Aug | EIP-7702 batch |
| $1.00M | RLB | Jan | Uniswap Permit2 |
Total large-case losses: $22.98M (27% of yearly total)
Signature Type Distribution (from >$1M cases)

| Type | Cases | Total Loss |
|---|---|---|
| Permit / Permit2 | 3 | $8.72M |
| Transfer | 2 | $4.87M |
| Approve / increaseApproval | 3 | $5.62M |
| EIP-7702 batch | 2 | $2.54M |
| setApprovalForAll | 1 | $1.23M |
Attack Trends
- EIP-7702 Exploitation: Emerged shortly after the Pectra upgrade, with attackers leveraging account abstraction to bundle multiple malicious operations into single signatures. August saw the largest cases ($2.54M from 2 incidents).
- Large Cases Concentrated in Q3: 6 of 11 large cases (≥$1M) occurred in July-September, correlating with peak market activity.
- Permit Dominance: Permit/Permit2 signatures accounted for 38% of large-case losses.
Comparison: 2023 → 2024 → 2025
| Aspect | 2023 | 2024 | 2025 |
|---|---|---|---|
| Total Loss | $295M | $494M (+67%) | $83.85M (-83%) |
| Victims | 324K | 332K (+3%) | 106K (-68%) |
| Avg Loss/Victim | $910 | $1,488 | $790 |
| Dominant Signature Type | Permit/Approve | Permit/setOwner | Permit |
| Major Drainers | Inferno, MS, Pink | Inferno, Angel | New drainers emerged |
Beyond Signature Phishing
While this report focuses on wallet drainer attacks, the broader threat landscape includes:
- Bybit Incident (Feb, $1.46B): Lazarus compromised a Safe{Wallet} developer machine, injecting malicious code that spoofed the multisig signing interface — 17x the year’s total signature phishing losses
- Supply Chain Attacks: npm publish credentials stolen via phishing, enabling attackers to inject malicious code into open-source packages; self-replicating worms backdoored hundreds of packages, exfiltrating environment variables and credentials
- Frontend Compromises: Malicious transaction requests injected into legitimate platform interfaces
- Social Media Hijacks: Project X accounts compromised to post phishing links
- Malware & Info Stealers: Fake verification pages, malicious Telegram bots, DPRK IT worker infiltration — targeting private keys and credentials
Outlook
Lower losses ≠ gone threats.
- If markets are active, phishing activity may rise with them — wallet security integration and user education remain critical defenses.
- The decline in trackable losses may partly reflect a shift toward harder-to-track attack vectors — private key compromises and targeted social engineering are not captured in drainer statistics.
- The threat landscape is bifurcating: mass phishing for retail users vs. sophisticated supply chain/APT attacks for high-value targets.
- The drainer ecosystem remains active — as old drainers exit, new ones emerge to fill the gap.
The numbers change. The threat persists. Stay vigilant.
Scam Sniffer Research | December 2025